Integration latency under agent merge volume
An experiment on whether moving main-branch integration onto the agent rig shortens lead time to a green main and time to restore a red one.
Question
When agents raise the merge rate, does moving main-branch integration from GitHub-hosted runners onto the machine that runs the agents shorten lead time from merge to a green main, and time to restore a red main?
Hypothesis
Over 14 days of local runs, median lead time to green main falls by at least 30% and median time to restore falls by at least 40% against the hosted baseline, while p90 queue wait stays under 2 minutes. Time to restore should fall more than lead time, because each repair attempt waits for a full run.
Result
We recorded the hosted baseline from 120 completed main runs (Oct 12–21). On the first day on the rig, eight successful main runs took 10.7–11.2 min (median about 10.8 min), against 13.6–18.2 min on hosted runners in the two days before. Three local runs failed, two on test failures in new code and one killed by a runner bug we have since fixed. Lead time and time to restore need the full 14 days before any comparison.
Next experiment
Does agent work slow CI, or CI slow the agents, when both share the rig at peak merge volume?
Failure modes
- 01 One runner takes one job at a time, and the workflow's concurrency setting serializes main runs. At peak merge volume, queue wait can erase the run-time gain.
- 02 The rig becomes the only gate for main. When it is down or saturated, main goes unverified.
- 03 Agent work and CI compete for the rig's CPU and memory, and contention can slow both.
- 04 Suite growth can hide the effect. Hosted run time grew from 4.5 to 18 minutes in nine days, so a larger suite can cancel a faster runner.
Why this measures alignment latency
TwelveApart’s alignment-bandwidth thesis holds that as agent output rises, the limit moves to how fast a supervising layer detects and corrects drift. On RoughPatch, the product our agents build, main-branch integration is where we learn whether their combined changes pass the full suite. Lead time to green main measures how fast we learn it; time to restore measures how fast we correct it.
Method
The data comes from the GitHub Actions API: every main-branch run of the
quality workflow since the first one on October 12. We use attempt 1 of each
run (no run had a second) and exclude cancelled runs (3 so far).
- Run time: the integration job’s start to finish.
- Queue wait: run creation to the integration job’s start.
- Lead time: a pull request’s merge to the completion of the first successful main run that includes its merge commit. We report merges that started their own run separately from documentation-only merges, which wait for the next code push.
- Time to restore: an incident starts when a main run fails after a success and ends with the next successful main run. One incident can span several failed runs.
- Change failure rate: failed runs over completed runs. We haven’t yet sorted failures into regressions, flaky tests and infrastructure, so this rate mixes all three.
The hosted period ends at 18:29 UTC on October 21, when main moved to the rig. We stop after 14 days of local runs and compare medians and p90s.
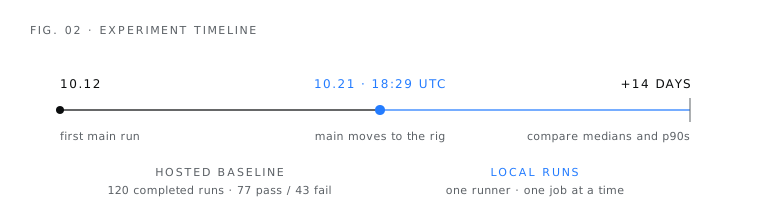
Baseline (hosted, Oct 12–21)
| Measure | Value |
|---|---|
| Completed main runs (pass / fail) | 77 / 43 |
| Change failure rate | 35.8% |
| Run time, median / p90 | 8.4 min / 14.4 min |
| Run time, daily median | Oct 12: 4.5 · Oct 16: 6.3 · Oct 19: 8.8 · Oct 20: 13.6 (23 runs) · Oct 21: 18.2 min (1 run) |
| Queue wait, median / max | 3 s / 59 s |
| Lead time, merges with their own run (119), median / p90 | 12.9 min / 65.3 min |
| Lead time, all measured merges (148), median / p90 | 15.4 min / 87.4 min |
| Time to restore (20 incidents), median / mean / worst | 32 min / 44 min / 2 h 15 min |
| Merged pull requests, peak day | 44 on Oct 19 |
| Hosted minutes billed for main runs | about 1,074 of the 2,000 monthly free minutes |
Of 200 merged pull requests, 50 merged before the first main run and two have no measurable lead time yet, which leaves 148.
Setup
GitHub’s standard hosted runner for a private repository has 2 vCPUs. The local runner is a one-job container on a 32-core, 60 GiB workstation that also runs the coding agents. Each job gets 6 CPUs, 16 GiB of memory and a fresh disk volume. We registered one runner, so local main jobs run one at a time. Pull-request checks stay on hosted runners. The companion essay describes the isolation design.
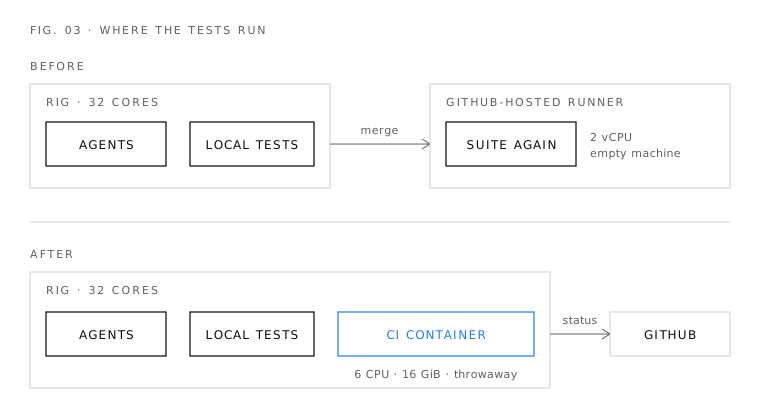
The suite runs lint, type and commit checks; architecture, unit, service, contract and quality tests; Python scoring tests; browser tests against a production build; and Storybook component tests.
First measurements
| Run | Runner | Setup | Tests | Total |
|---|---|---|---|---|
| Last hosted main run | Hosted, 2 vCPU | about 140 s | 934 s | 18 min 12 s |
| Acceptance run (branch) | Rig, 6 CPU | 82 s | 537 s | 10 min 30 s |
| First local main run | Rig, 6 CPU | 86 s | 549 s | 10 min 45 s |
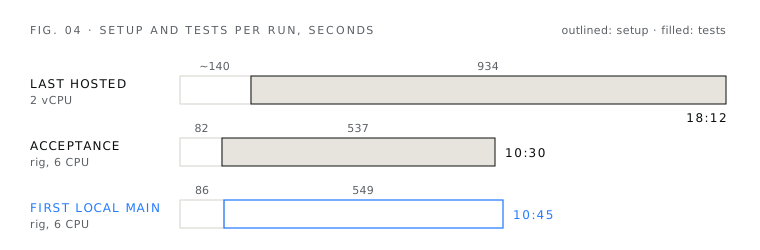
The stages before the browser tests took 392 s in the hosted run and 130 s in the acceptance run. The browser stage went from about 542 s to about 407 s.
The second local main run failed at 19:00:50 UTC. Our runner supervisor started the job’s time limit when the runner began waiting for work, then killed a job that arrived after 11 idle minutes. We fixed that before collecting more data and count the run as a failure of the runner setup, not of the code under test.
First day on the rig (Oct 21)
| Measure | Value |
|---|---|
| Successful main runs | 8, from 10.7 to 11.2 min, median about 10.8 min |
| Failed main runs | 3: two test failures in new code, one runner kill |
| Time to restore (3 incidents) | 19 min, 38 min and 86 min |
| Queue wait | 3–6 s |
The 86-minute restore overlapped a planned orchestrator restart, so it overstates repair time. A pip download cache, added on day one, cut setup by only 1–6 s (80–82 s against 81–86 s), so dependency downloads aren’t where setup time goes. Run times stayed flat while the suite kept growing, which favors the hardware explanation over a one-off measurement.
Limits
The baseline and the local runs use different hardware, and the suite grows during both periods. Three incidents can’t support a time-to-restore comparison yet. If the 14-day comparison is ambiguous, we’ll add a paired benchmark, the same commit run several times on each runner type, to separate hardware from suite growth.